Kumarhane keyfi yaşamak için bettilt tercih ediliyor.
Bahis severlerin ihtiyaçlarına göre sürekli yenilenen pinco kullanıcı dostudur.
Kazancını artırmak isteyen oyuncular bettilt fırsatlarını değerlendiriyor.
Kumarhane eğlencesini dijital dünyaya taşıyan bahsegel çeşitliliği artıyor.
Adres değişikliklerinde en güncel bağlantı olan bahsegel önemlidir.
Bahis severler için en geniş spor kategorilerini sunan bahsegel eğlencenin merkezindedir.
Bahis dünyasında ortalama kullanıcı yaşının 32 olduğu belirtilmiştir; pinco giriş bu yaş grubuna özel promosyonlar sunmaktadır.
Yatırım işlemlerinde hız ve güven sağlayan bettilt giriş kullanıcı dostu bir yapıya sahiptir.
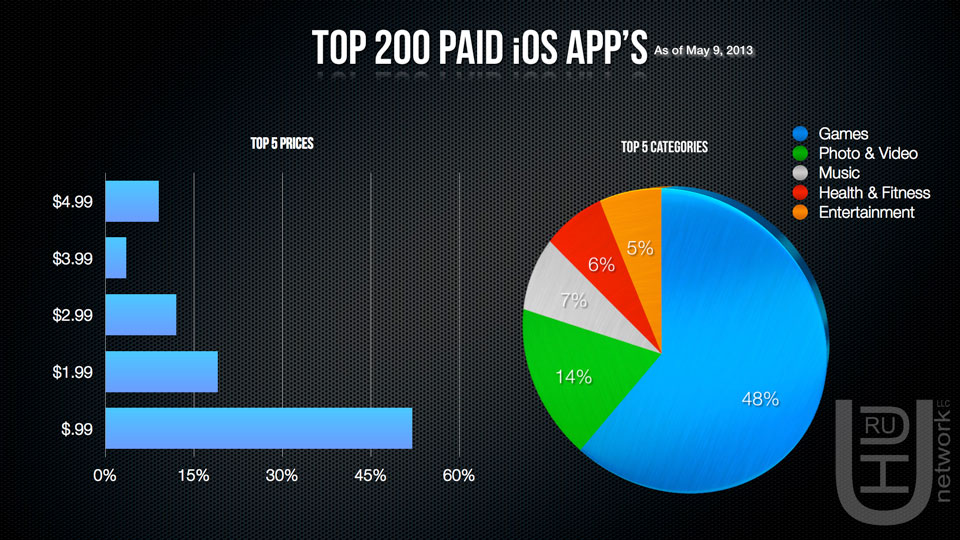
Top 200 Paid iOS App’s May 9th 2013 Statistical Data
| Price |
Total |
% |
| $0.99 |
104 |
52% |
| $1.99 |
38 |
19% |
| $2.99 |
24 |
12% |
| $3.99 |
7 |
3.5% |
| $4.99 |
18 |
9% |
| $5.99 |
1 |
0.5% |
| $6.99 |
4 |
2% |
| $7.99 |
1 |
0.5% |
| $8.99 |
0 |
0% |
| $9.99 |
3 |
1.5% |
| Category |
Total |
% |
| Games |
95 |
47.5% |
| Photo & Video |
28 |
14% |
| Music |
13 |
6.5% |
| Health & Fitness |
11 |
5.5% |
| Entertainment |
10 |
5% |
| Productivity |
8 |
4% |
| Utilities |
6 |
3% |
| Social Networking |
4 |
2% |
| Reference |
4 |
2% |
| Lifestyle |
4 |
2% |
| Business |
3 |
1.5% |
| Education |
3 |
1.5% |
| Weather |
3 |
1.5% |
| Sports |
2 |
1% |
| Food & Drink |
2 |
1% |
| Navigation |
2 |
1% |
| Books |
1 |
0.5% |
| Finance |
1 |
0.5% |
What does this data say about the iOS App Store market? Does/should it impact your mobile strategy? Let us know in the comments.